
TTFB is a performance metric that measures the time from when a browser requests a page until the first byte reaches the user, and it especially determines the “starting moment” of perceived site speed. When you improve TTFB, it prevents metrics like LCP/FCP from “starting late”; this brings higher results in SEO performance.
The importance of TTFB on the SEO side is this: if your server response is slow while Google/Yandex/Bing bots crawl your site, crawl efficiency can decrease, and on the user side the feeling of the page “loading” is delayed. Therefore, TTFB is one of the clearest signals that points to “infrastructure and server response” issues before content and front-end optimization.
What Is TTFB?
TTFB (Time to First Byte) is the time from when the client (browser) starts a request until it receives the first byte of the response from the server. In a navigation request (HTML document), since TTFB comes before other loading metrics, it can be thought of as the metric that “starts” the performance chain of the page.
Which Elements Are Considered in the TTFB Metric?
TTFB is not a single “server time”; especially in page navigations it should be considered as the total of the following stages:
-
- DNS resolution: Converting the domain name to an IP
- Connection setup: TCP connection
- Secure connection: TLS handshake (HTTPS)
- Server processing time: Application/DB queries, cache status, template render
- Response start: The first byte reaching the client
Therefore, when TTFB increases, the problem can sometimes be on the server side (DB/cache/hosting), and sometimes in layers such as network/location/CDN.
What Should the Ideal TTFB Score Be?
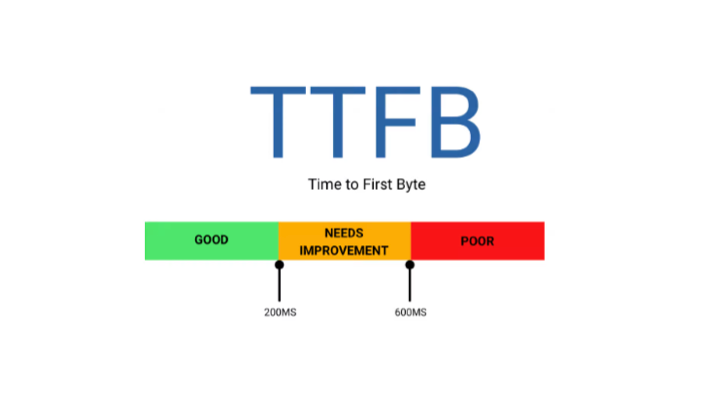
In Google’s web.dev guides, “rough guideline” thresholds for TTFB are given as follows (targeting is generally done with a p75 logic):
- Good: ≤ 0.8 s (800 ms)
Page metrics “start” faster; the delay chain on the LCP/FCP side decreases.
- Needs Improvement: 0.8 – 1.8 s
Because the first response is late, the “loading feeling” becomes heavier; performance loss becomes more noticeable especially on mobile.
- Poor: > 1.8 s
The server response is clearly slow; it drags other metrics with it and is considered a priority technical problem.
Additional note (so it doesn’t get confusing): Lighthouse’s “Reduce server response times” audit may mark anything above 600 ms for the main document as a “slow response.” This is a Lighthouse audit threshold; it’s normal for it to look different from web.dev TTFB thresholds.
How Is TTFB Measured?
When measuring TTFB, reading both lab (simulation) and field (real user) data together is the healthiest approach.
- Google PageSpeed Insights: Provides Lighthouse-based lab results; on eligible pages it also shows a real user (CrUX) summary.
- Lighthouse (Chrome DevTools): Helps diagnose TTFB-related slowness with “Server response time” and related network findings.
- Google Search Console (Core Web Vitals): Not a direct TTFB report; but problems like LCP/FCP triggered by TTFB appear here as “URL groups.”
- WebPageTest: Shows very clearly via waterfall why “the first byte is coming late?” with different location/device profiles (especially useful for capturing CDN/location impact).
How to Optimize TTFB?

The headings below are arranged according to the practical improvement areas highlighted in the web.dev “Optimize TTFB” approach.
Strengthen the cache strategy (fastest gain)
If the server has to regenerate the page/HTML on every request, TTFB increases. Page cache (full-page cache), object cache, and a proper cache invalidation setup significantly reduce TTFB.
Use a CDN and evaluate edge caching
If the user is far from the server, connection delays increase; static content speeds up with a CDN, and in some scenarios HTML caching from the edge also improves TTFB. The difference is more visible especially when targeting global traffic.
Improve hosting / server resources (CPU, RAM, disk, network)
High TTFB can sometimes be entirely infrastructure-related: high CPU load, slow disk I/O, limited PHP workers, etc. If TTFB doesn’t drop even after front-end optimization, you need to address the server layer.
Optimize database queries and application business logic
Slow queries, bloated query counts, missing indexes, or heavy plugin/builder structures increase server processing time. Especially in WordPress, unnecessary plugins and heavy theme structures can raise TTFB.
Reduce connection setup costs (DNS/TLS optimization)
DNS provider quality, TLS settings, and optimizations like keep-alive shorten the “first byte” path. CDN and correct DNS configuration create an indirect but strong impact here.
Speed up priority content generation (SSR/streaming logic)
If the application starts producing and sending HTML late, TTFB increases. In some architectures, server-side rendering, streaming, or sending critical content earlier improves TTFB and first paint metrics.
Conclusion
TTFB forms the basis of site speed because it shows “how quickly the page responds” to the user and directly affects the performance of metrics like LCP/FCP. When you reduce TTFB with the right steps such as cache, CDN, server resources, and database optimization, your Core Web Vitals scores become more stable, crawl efficiency increases on the technical SEO side, and you build a stronger infrastructure for organic visibility. If TTFB remains consistently high on your site and the same warnings keep appearing in speed tests, we can create and implement a site-specific speed improvement plan within SEO manager.